The Asian Session on ES: Reading Sydney and Tokyo Order Flow
Your working day sits inside the quietest hours of the ES. Here is what the thin book does to order flow, which four events actually move it, and the one hour that is worth your attention.
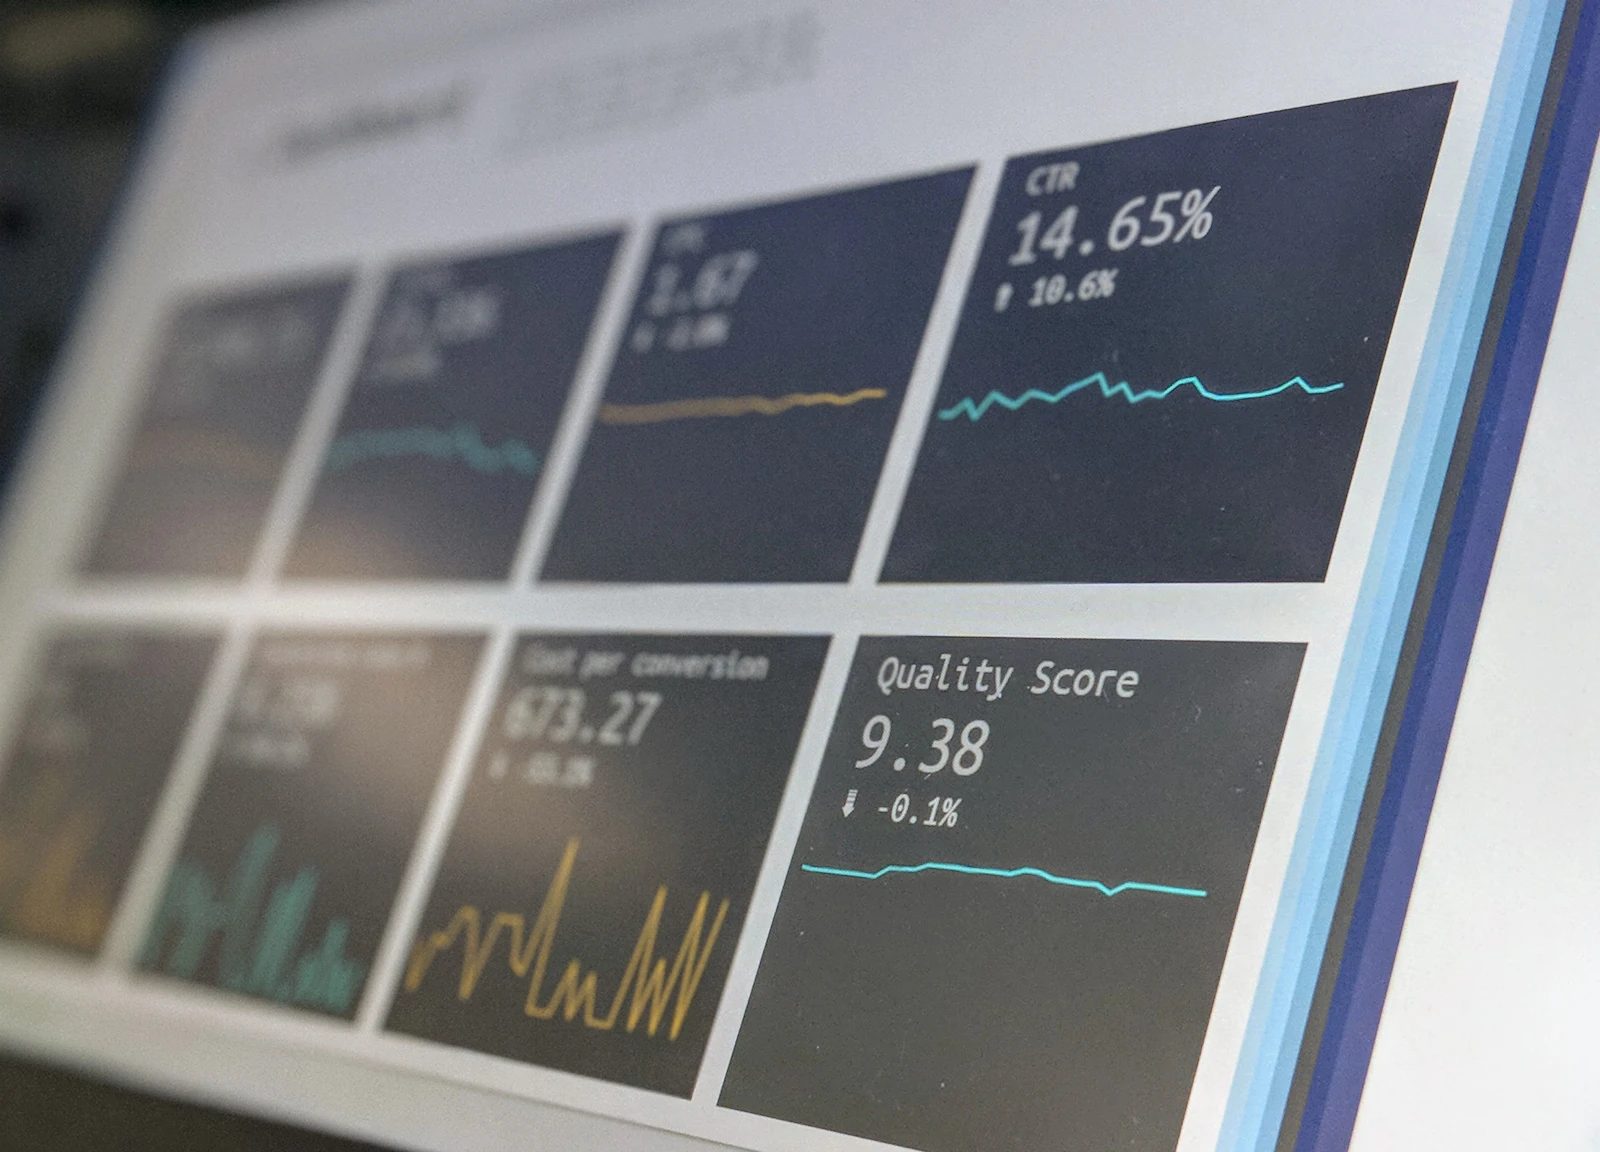
Nine in the morning in Sydney and the S&P 500 has already been trading for fifteen hours. That is the first thing to settle if you live in Australia and want to trade the ES: you are never early to this market, you are always late to it. The US cash session closed while you were asleep, the overnight session has been grinding through Tokyo, and by the time you sit down with coffee the contract has printed a high and a low that American traders will treat as reference levels when they get to their desks.
So the question is a fair one. Is there anything worth trading in those hours, or is the Asian session on ES just thin noise with a wide spread and a stop-run every twenty minutes?
Both, depending on the hour. And the difference is structural, not a matter of how good you are. Once you understand where the liquidity actually sits in a 23-hour contract, the Australian working day stops looking like a handicap and starts looking like what it is: a session with a small number of decent setups and a very large number of traps.
Your working day sits inside the ES overnight session
Get the clock right before anything else, because Australia and the United States run their daylight saving in opposite directions and the offset changes twice a year in each country.
The ES trades on CME Globex from Sunday evening to Friday afternoon US Central Time, with a one-hour break each day starting at 4:00pm CT and a short halt for equity index products in the afternoon before it. The current schedule is published by the exchange on the CME Group trading hours page, and it is worth checking around holidays because early closes are common.
Translated to eastern Australia:
| Event | Sydney in AEST (winter) | Sydney in AEDT (summer) |
|---|---|---|
| US cash close, 4:00pm New York | 6:00am | 8:00am |
| Globex daily halt | 7:00am to 8:00am | 9:00am to 10:00am |
| Globex reopen for the new session | 8:00am | 10:00am |
| Tokyo cash open | 10:00am | 11:00am |
| Shanghai and Shenzhen open | 11:30am | 12:30pm |
| London cash open | 5:00pm | 7:00pm |
| US cash open, 9:30am New York | 11:30pm | 1:30am |
Two consequences fall out of that table immediately. In the southern summer, the ES stops trading for an hour right in the middle of your morning, from nine to ten, and the new session opens at ten with a fresh daily volume count and a gap that is often a couple of points wide. In the southern winter the same event lands at seven and eight, before most people have opened the platform. Either way, the reopen is the single most useful moment of the Australian morning, and it is the one people miss because they treat it as a non-event.
The second consequence is that the Australian business day and the ES high-volume session never overlap. Not for a minute. The US open happens at 11:30pm or 1:30am Sydney time. If you keep a job, you trade ES in its quietest hours or you trade it at night. There is no third option, and a lot of Australian frustration with this contract comes from refusing to accept that.
Why the tape empties out after the US close
Volume on the ES is not spread evenly across the 23 hours. It is heavily concentrated in the US cash session, with a secondary cluster around the European open and a third around the US futures reopen. Between the Tokyo open and the London open, the contract trades on a fraction of its daily volume. You do not have to take that on faith: put a session volume profile on a five-day chart and look at how flat the Asian portion is compared with the US portion. The picture is the same every week.
What thin volume does to order flow is specific and predictable:
- The book gets shallow. Fewer contracts resting at each price means a single moderate order walks through several ticks instead of being absorbed at one. Moves that look impulsive on the chart are often one participant, not a crowd.
- Spread widens off the single tick. The ES is usually one tick wide in the US session. In Asian hours it flickers wider, and market orders start costing you more than the commission does.
- Delta becomes noisy. Cumulative delta is a ratio of aggressive buys to aggressive sells. With few trades in the sample, one 50-lot distorts the whole reading. Footprint imbalances that would be meaningful at 10:00am New York are frequently meaningless at 10:00am Sydney.
- Absorption is rare, and that matters. Absorption, a large resting bid eating repeated selling without giving ground, is the cleanest read in order flow. It needs a large passive participant. Those participants are mostly asleep during Asian hours, so the signal you are looking for often simply is not there to find.
- Stops are cheap to reach. Not because of conspiracy, but arithmetic. If it takes 200 contracts to move price ten ticks instead of 2,000, then the cluster of stops above the overnight high is within reach of a much smaller participant.
None of this makes the session untradeable. It makes it a different game, one where you are trading the structure of a range rather than the momentum of a trend.
What actually moves ES while you are at work
There are four kinds of event that put real volume into the ES during the Australian day, and it helps to know them because everything else is drift.
US after-hours earnings. The largest S&P names report after the New York close, which is early morning in Sydney. A megacap miss or beat repricing the index at 6:30am AEST is a genuine order flow event with volume behind it, and it is the one time in the Asian window where a momentum read behaves the way it does in the US session.
Bank of Japan decisions. The BoJ does not publish at a fixed minute, which is a real operational difference from the Fed. The statement lands somewhere around the middle of the Japanese day, which is early afternoon in Sydney, and the yen reaction bleeds into the equity index through the carry trade. If you have ever watched ES drop for no visible reason while the AUD/JPY is falling out of bed, that is the mechanism.
Chinese policy and data. Releases from Beijing land in your late morning and lunchtime. They move the AUD and the miners hard and the ES modestly, but the modest move happens in a thin book, so it prints large candles that fade.
Headlines. Geopolitics, tariffs, anything that arrives outside a calendar. In a thin book the initial move overshoots badly, which is both the opportunity and the way most people get hurt.
Notice what is not on that list: Australian data. The Australian Bureau of Statistics publishes at 11:30am AEST, and the RBA publishes its Monetary Policy Board decision in the early afternoon with a press conference after it, with the calendar on the Reserve Bank of Australia site. Both of those flatten the AUD and the SPI 200. Neither does much to the S&P 500. If you want to trade the local calendar, trade a local instrument. The ES does not care that Australian unemployment came in two tenths hot.
Reading order flow when there is almost nothing to read
The mistake is to use the same tool settings you would use at the US open. A footprint chart configured for a liquid session shows you a blur of single-digit numbers in Asian hours, and a blur invites you to see patterns that are not there.
Three adjustments do most of the work.
Change the bar basis. Time bars in a thin session produce a lot of bars with very little inside them. Volume bars or tick bars normalise this: each bar contains the same amount of activity regardless of how long it takes to build. A 2,000-volume bar that takes twelve minutes in Asia and forty seconds at the US open is telling you a consistent story about participation, where a five-minute bar is not.
Raise your imbalance thresholds. If your footprint flags a three-to-one imbalance as significant, in a thin book that fires on almost every bar. Push the threshold up and demand a larger absolute size before you call something an imbalance, or filter out bars below a minimum volume entirely.
Trade the edges, not the middle. The realistic Asian-hours structure is a range. Overnight inventory gets built, price rotates inside it, and the edges of that range are where the limited participation concentrates. Trading from the edge of a developed range back into it, with a stop beyond the extreme, is a setup that survives thin liquidity. Chasing a break of the range at 11am Sydney is a setup that mostly does not, because there is no follow-through volume until Europe arrives.
The exception, and it is a real one, is the hour around the European pre-open. From roughly 4:00pm to 5:00pm AEST the book starts to fill, the spread tightens back to a tick, and breaks of the Asian range begin to carry. That hour is the best liquidity an Australian trader can reach without staying up late, and it happens to sit at the end of the working day.
The levels the Asian range leaves behind
Even if you decide the session is not worth trading directly, the hours you can watch produce the levels the rest of the day uses. This is the argument for paying attention to Asia even as a night trader.
The overnight high and low, meaning the extremes printed between the Globex reopen and the US cash open, are among the most widely watched reference points on the ES. They show up on every American trader's chart as the boundary of the pre-market range. When the US session opens and immediately takes out the overnight high, that is information about intent. When it opens inside the overnight range and stays there, the day frequently becomes a rotation.
The same applies to the volume point of control built during Asian hours. It is a low-volume node in the context of the full day, but it is a genuine node, and price returning to it during the US session tends to slow down there.
For an Australian trader this is a practical advantage. You watched that range form. You know whether the high was made on a single air-pocket spike at 2am local or on twenty minutes of steady buying. An American waking up at 8am New York sees only a line on the chart. That context is worth more than most of the trades available inside the session itself.
Sizing, costs and the case for the micro
The ES is worth 50 US dollars per index point, so a single tick of 0.25 points is 12.50 US dollars. The MES, the micro version, is a tenth of that: 5 dollars a point, 1.25 dollars a tick. Both trade essentially around the clock on the same schedule.
In a thin session the practical difference is not the risk per trade, it is the exit. Getting out of one ES contract in Asian hours is fine. Getting out of ten at once, in a hurry, against the move, is where the shallow book bites. If you are learning the session, or testing whether your read works at 11am Sydney rather than 11am Chicago, size in micros and keep the position small enough to exit on a limit order rather than a market order.
There is a currency layer too, and it is easy to forget. Your account is denominated in US dollars. A tick is 12.50 USD, not 12.50 AUD, and your profit and loss in Australian dollar terms moves with the AUD/USD rate as well as with the trade. A month where you made a modest USD profit and the Australian dollar rallied five per cent can be a flat month at home. Deposits and withdrawals carry a conversion cost each way, so batch them rather than moving money weekly.
Also worth noting: a US dollar futures account earns interest on cash in some structures and not in others, and any interest is income. Which brings us to the local paperwork.
Where ASIC and the ATO fit in
Two Australian-specific points that catch people out.
The first is the difference between exchange-traded futures and the CFD products that dominate Australian retail advertising. ASIC's product intervention order restricts leverage on retail CFDs, with tighter caps on stock index products than the marketing of a few years ago implied, along with negative balance protection and restrictions on inducements. Those rules apply to CFDs issued by an Australian licensee. They do not apply to a CME-cleared futures contract held through a US futures commission merchant, which sits under United States regulation and has its own margin regime set by the exchange and the broker. Neither arrangement is automatically safer than the other. They are different animals with different protections, and ASIC's consumer material on complex and leveraged products is on Moneysmart along with the register of licensed providers. Check that anyone offering you a futures account in Australia is licensed to do so, and remember that leveraged futures can lose you more than the balance in the account.
Connection, data and latency from Australia
Physical distance is real. A packet from Sydney to the CME data centre in Aurora, Illinois crosses the Pacific, the United States, and several networks on the way. On a normal domestic connection expect a round trip measured in the low hundreds of milliseconds. Do not guess: run a ping or a traceroute to your broker's gateway and look at the actual number, because it varies a lot by ISP and by whether your traffic exits Sydney or Perth.
What that latency costs you depends entirely on your style. For a swing or intraday trader holding for points, a fifth of a second on the order round trip is irrelevant next to the spread. For anyone scalping single ticks or running a strategy that reacts to the tape, it is the whole game, and the answer is a virtual private server located near Aurora. The strategy then runs beside the exchange and your remote desktop connection carries the latency instead, which is a much better trade: a slightly laggy screen is survivable, a slow order is not.
For the data itself, order flow work needs unfiltered tick data, not one-minute bars. That means a feed that delivers every trade and the depth of book, which in the NinjaTrader world usually means the broker's own professional feed or a dedicated market data provider. Budget for the exchange's market data fee on top of your broker's commission, and check whether you are classified as a non-professional subscriber, because the professional rate is many times higher and the classification depends on things like whether you are registered with a regulator or trade for a business rather than for yourself.
A realistic plan for the Australian day
Pulling it together into something you could actually run alongside a job:
- Early morning. Check what happened overnight in the US session and what reported after the close. Mark the US session high, low and settlement.
- The reopen, 8:00am AEST or 10:00am AEDT. Watch the first fifteen minutes. The gap from the settlement and how quickly it fills tells you something about overnight sentiment, and it is cheap information.
- Mid morning to early afternoon. Range hours. If you trade at all, trade the edges of the developing range in micros with defined risk, and accept that many days offer nothing.
- 4:00pm to 5:00pm AEST. The European pre-open. The best liquidity of your waking day and the point where a break of the Asian range starts to mean something.
- Evening. If you want the US open, it is 11:30pm or 1:30am local. That is a lifestyle decision, not a trading one, and doing it badly on four hours of sleep is worse than not doing it.
The traders who make the Australian timezone work do not usually beat the session. They use it to prepare, take the two or three hours that actually offer liquidity, and stop pretending that a 2am alarm three nights a week is sustainable. It is a smaller edge than the one available to somebody living in Chicago, and it is honest about being smaller.
This article is general information about market structure, regulation and tax in Australia, and it is not financial, tax or legal advice. Rules and exchange schedules change, and your own situation may be treated differently, so check the current position with the relevant authority and with a licensed Australian adviser before you act on any of it.
Educational content, not investment advice. Trading futures involves substantial risk of loss and is not suitable for every investor. Any reference to Algomyth results is hypothetical, simulated over historical data, and shown in full on the performance page; past performance does not guarantee future results.
Take the seat: watch the engines live
Three specialist engines on Nasdaq, S&P and Gold, every signal streamed the moment it happens, with the stop and the target written before the trade. From $149 a month per market.
Keep reading
 Order flowReading the DOM on US Hours: What You See WhenThe same ladder on the same contract shows you two completely different markets at 2 a.m. and at 8:35. Here is how the book changes hour by hour from Chicago, and which hours are worth your attention.
 Order flowFESX or ES? What Irish Traders Should Trade Around ECB DaysIn Dublin the ECB decision lands at 13:15 and the US open at 14:30. That gap decides whether your Thursday belongs to the Euro Stoxx future or to the E-mini, and your account currency decides the rest.
 Order flowOrder Flow for Greek Traders: The Evening E-mini SessionThe American cash open lands at half past four in Athens, after work and before bedtime. That is the only window where the order book is dense enough for tape reading to mean anything.