Order Flow on the E-mini for Romanian Day Traders
The ES opens at 16:30 Bucharest time and nobody writes about how to read it from here. Tick value, DOM, absorption and risk in lei, for traders in Romania.
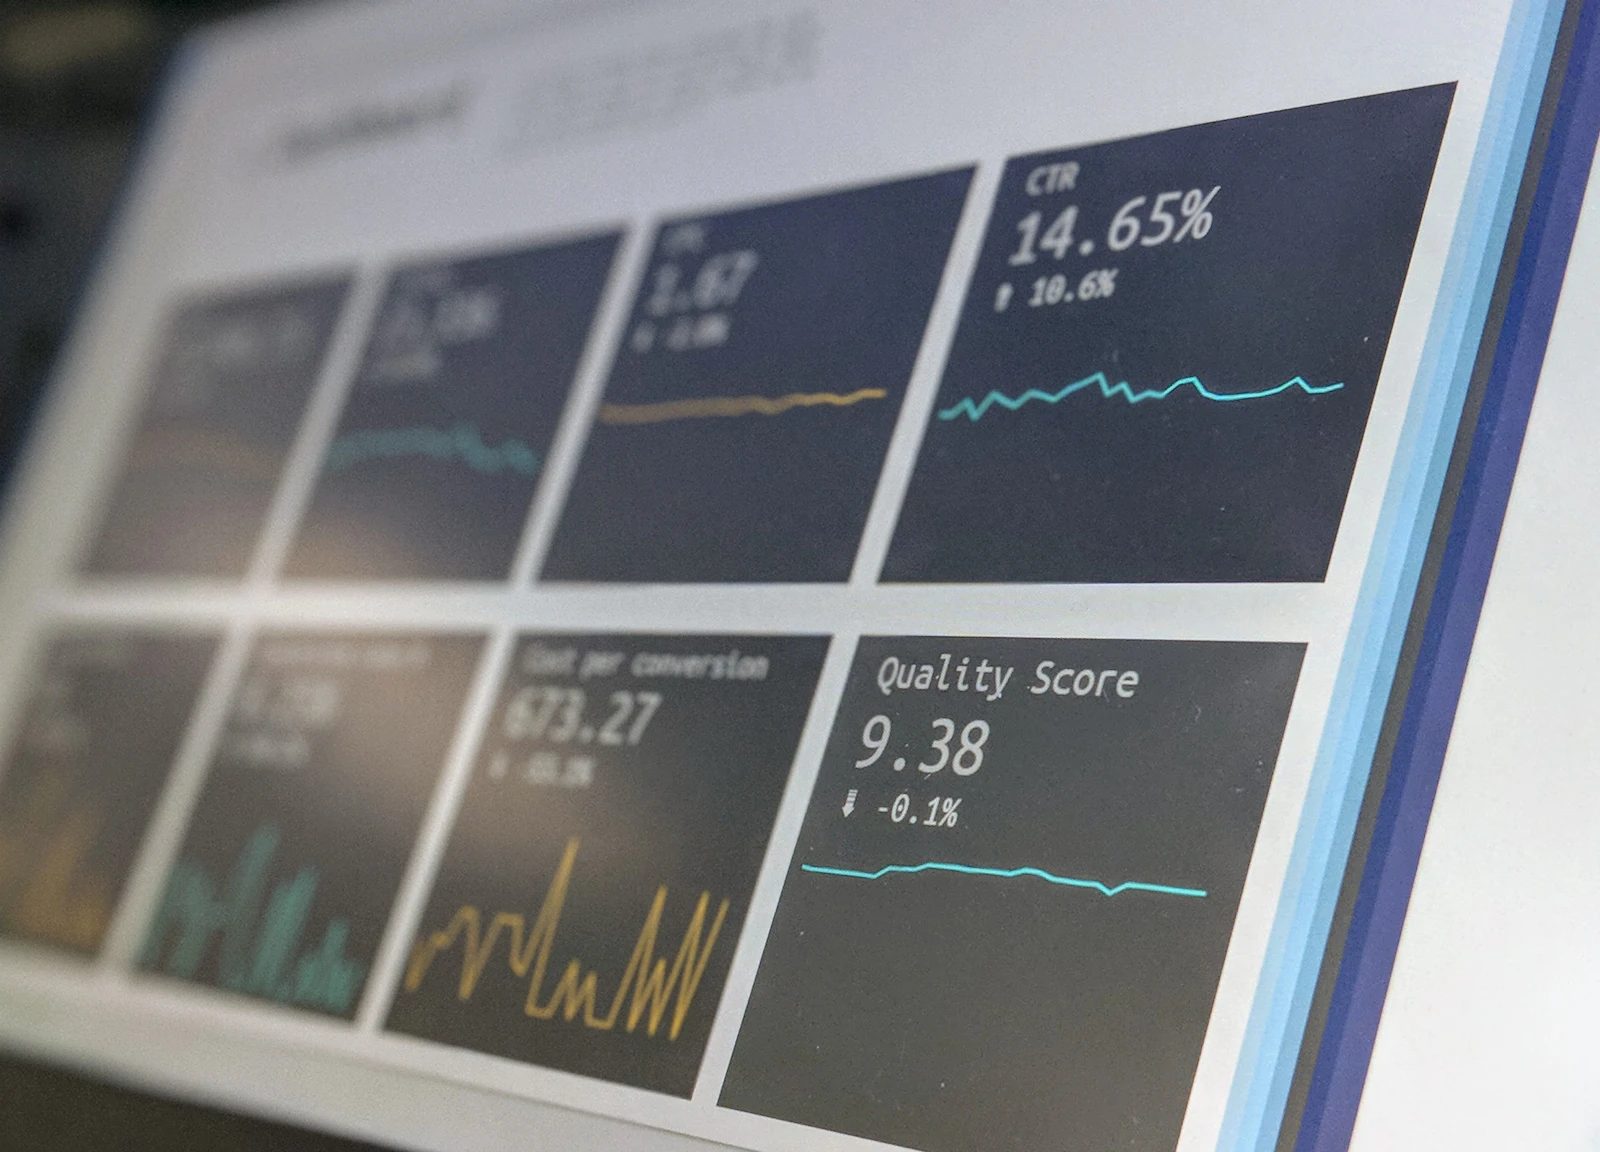
At 16:30 Bucharest time the American cash session opens and the E-mini S&P 500 starts doing the only thing it does well: moving a lot of size very fast. If you trade from Bucharest, Cluj, Timisoara or a flat in Iasi, that is your evening. And unlike the crowd trading the DAX before lunch, you have almost nothing written in your direction about how to read the tape once you get there.
This article fixes part of that. It is about order flow on the E-mini, what the DOM and the footprint actually show you, and the handful of adjustments that matter specifically when you are trading a dollar contract from a country that settles in lei.
Why the E-mini and not the local market
The Bucharest Stock Exchange is a real market with real companies, but it is not a day trading venue. Spreads widen, depth thins out and a market order of any size moves the price against you. Order flow reading, in the sense used here, needs a book deep enough that the queue in front of you is information rather than noise.
The E-mini S&P 500 is the opposite case. It is among the most heavily traded futures contracts in the world, quoted in a quarter point tick, with thousands of contracts resting at the inside prices during the American session. That depth is precisely what makes the tape readable: when a level absorbs two thousand contracts and does not break, that is an event you can see, measure and act on. In a thin book, the same two thousand contracts would simply be the entire market.
The contract you are actually reading
Before the tape, the arithmetic. The E-mini S&P 500, symbol ES, has a multiplier of 50 dollars per index point. The minimum price increment is 0.25 index points, so one tick is worth 12,50 dollars per contract. The Micro E-mini, symbol MES, is one tenth of that: 5 dollars per point, 1,25 dollars per tick.
Write those two numbers somewhere you can see them, because everything else in risk management follows from them. A stop placed eight ticks away on one ES contract is 100 dollars. The same stop on one MES contract is 10 dollars. A trader learning to read absorption should be doing it in micros, not because micros are a toy, but because tuition paid at 1,25 dollars a tick lasts ten times longer.
Both contracts are quarterly, listed for March, June, September and December, and both are cash settled against the opening print of the third Friday of the expiry month. Volume rolls from the front month to the next one about a week before expiry. If your footprint chart suddenly looks empty in the second week of March, June, September or December, you are almost certainly still looking at the dying contract. Check the symbol before you conclude the market has died.
What order flow shows that a candle does not
A candle tells you where price opened, how far it stretched, and where it closed. It does not tell you what it cost to get there. Order flow is the attempt to answer that second question.
Two data streams do the work. The first is the book, the depth of market, which shows resting limit orders waiting at each price: intention, but intention that can be cancelled at any instant. The second is the time and sales, the record of trades that actually printed, with size and with the side of the book that was hit. Intention lies. Executions do not.
A footprint chart, sometimes called a cluster or numbers bars chart, is just a way of stacking those executions inside a candle so you can see, price by price, how many contracts traded into the bid and how many into the offer. Instead of a single red body you see that most of the selling happened in the top third of the bar and that the bottom two ticks traded almost nothing. That is a different story than the candle told you.
None of this predicts anything. Order flow is a description of the present, with better resolution than a bar chart. The edge, if there is one, comes from recognising situations where the description is inconsistent with the price action that follows, and having a rule for what to do about it.
A third stream sits on top of both: cumulative delta, the running total of contracts traded into the offer minus contracts traded into the bid. On its own it is close to useless, because in a futures market every buyer has a seller and the total always nets to zero. What makes it readable is divergence. When cumulative delta climbs steadily while price refuses to make a new high, aggressive buyers are paying up and getting nothing for it. That is the same information absorption gives you, expressed as a line instead of a grid, and traders tend to find one of the two representations clicks for them and the other does not.
Absorption, exhaustion and the two mistakes
Two patterns carry most of the practical weight.
Absorption is aggressive volume meeting a passive wall and failing to move price. Sellers hit the bid repeatedly at 5.842,00, thousands of contracts print at that level, and the price does not go through. Somebody large is buying everything that is thrown at them. When the selling runs out and price lifts off that level, the move tends to be sharp, because the aggressive sellers now need to buy back.
Exhaustion is the mirror image at the end of a move. Price has run thirty points, the last leg prints heavy volume into the offer, and then the next bar makes no new high on similar volume. The buyers are still buying, they have simply stopped getting paid for it. A stalled advance on high volume is a more useful signal than a stalled advance on nothing.
The two mistakes that follow are equally standard. The first is treating a large resting order in the DOM as a wall. It is a limit order. It can be pulled in a millisecond, and in the ES it often is, precisely because everyone watching the book can see it. Only the printed trades at that price confirm anything.
The second is reading a single number instead of a sequence. One bar with a heavy delta means little. The same level rejecting three separate attempts, with each attempt printing less aggressive volume than the last, is a sequence, and sequences are what you build rules on.
A concrete example makes the difference obvious. Say the ES has spent forty minutes grinding down and arrives at a level that held twice the previous session. The footprint shows 1.400 contracts trading into the bid at that price and only 300 at the price below it, and the bar closes near its high. That combination, heavy sell aggression at a level with no follow through underneath, is the textbook shape of absorption. It is still not a trade. The trade, if you take one, needs a trigger, a stop on the far side of the level and an exit plan for the case where the wall was real for ninety seconds and then vanished. Traders who learn to spot the shape but never write down the rest of that sentence end up with excellent reads and a shrinking account.
The Romanian session clock
Time zones are where Romanian traders lose more money than they realise, because a missed open is a missed day.
Chicago runs the contract and the American equity cash session opens at 8:30 Chicago time. For most of the year that is 16:30 in Romania, and the cash close at 15:00 Chicago time is 23:00 here, with the futures session itself settling shortly after. Your working evening, if you trade the American open, is roughly 16:15 to 18:30 Romanian time for the first and most active stretch, and 21:30 to 23:00 for the close.
The catch is that the United States and the European Union do not change clocks on the same dates. The Americans move to summer time in the second week of March, while Romania waits until the last Sunday of the month. In autumn Romania goes back first, at the end of October, while the Americans wait until the first Sunday of November. During those two mismatch windows the open lands an hour earlier, at 15:30 Romanian time, and every year a number of traders sit down at 16:25 and find the first hour already gone. Put both switch dates in your calendar in January.
Practically, this schedule is one of the few genuine advantages of trading from Romania. The American open falls in the evening, after a normal working day, without the sleep deprivation that traders in Asia deal with. The overnight Globex session, thin and mostly driven by European hours, is a worse place to learn order flow: the book is shallower, the prints are sparser and the patterns above are far less reliable.
Sizing risk when your life is in lei
Your trading account is denominated in dollars. Your rent, your groceries and your tax return are in lei. Those two facts interact in ways that are easy to ignore until they matter.
Set your risk per trade in lei first, then convert. If you decide that a bad day costs you no more than a certain number of lei, work backwards through the current exchange rate into dollars, then divide by the tick value to get a stop distance and a position size. Doing it in the other direction, picking a number of contracts and seeing what happens, is how accounts die.
The reference rate to use is the official daily one published by the Banca Nationala a Romaniei, which posts the exchange rates of the currency market each business day. It is also the rate your accountant will reach for when converting foreign income, so using it from the start keeps your trading journal and your tax file consistent.
Remember too that the leu to dollar rate moves on its own. A flat year in dollars is not a flat year in lei, and a good year can be partly given back by currency. This is not a reason to hedge anything at retail size, but it is a reason to record results in both currencies.
Building the workspace in NinjaTrader
Order flow reading requires two things from your platform: real transactional data and a way to display it that does not overwhelm you.
The data comes first. Order flow needs tick by tick data, not one minute aggregates, and for full depth reading it needs a Level 2 subscription from the exchange. If your footprint looks suspiciously clean, check what data level you are actually paying for before you blame the tool. Historical tick data also matters, because you cannot study yesterday's absorption on data your platform never stored.
On the display side, restraint wins. A workable layout for the American open is one price chart for context, one footprint or cluster chart on a low timeframe or a tick based bar, one DOM, and a cumulative delta panel. That is enough. Adding four more indicators to the same screen does not add four more pieces of information, it adds four more chances to find a confirmation you were already looking for.
Before you fund anything, two Romanian checks
Two administrative points that cost nothing to handle in advance and a great deal to handle late.
One more habit worth building early: watch the same price levels every day rather than every level. The overnight high and low, the settlement price of the previous session, and the first fifteen minute range of the cash open are where the interesting order flow concentrates, because that is where resting orders accumulate. Reading the tape everywhere at once is exhausting and produces worse decisions than reading it carefully at four prices.
A realistic first month
If you are starting from candles and moving to order flow, the sequence that works is boring and it is the only one that works. Trade the micro contract. Trade one session window, ideally the first ninety minutes after the open, so your sample is comparable day to day. Record every trade with a screenshot of the footprint at entry, and write one sentence about what you thought you saw. Review the week on Saturday and separate the trades where the read was right from those where the read was wrong but the trade happened to work.
The advantage you have, trading from Romania, is a session that fits an ordinary life and access to the deepest equity index book in the world. The disadvantage is that almost nobody is writing about it in your context. The first is worth more than the second.
This article is general information about market structure and about how Romanian reporting duties are organised, not tax, legal or investment advice. Rules, rates and contribution thresholds change and each case depends on your own circumstances, so confirm your position with a licensed Romanian tax adviser or directly with the authority before you file or fund an account.
Educational content, not investment advice. Trading futures involves substantial risk of loss and is not suitable for every investor. Any reference to Algomyth results is hypothetical, simulated over historical data, and shown in full on the performance page; past performance does not guarantee future results.
Take the seat: watch the engines live
Three specialist engines on Nasdaq, S&P and Gold, every signal streamed the moment it happens, with the stop and the target written before the trade. From $149 a month per market.
Keep reading
 Order flowReading the DOM on US Hours: What You See WhenThe same ladder on the same contract shows you two completely different markets at 2 a.m. and at 8:35. Here is how the book changes hour by hour from Chicago, and which hours are worth your attention.
 Order flowFESX or ES? What Irish Traders Should Trade Around ECB DaysIn Dublin the ECB decision lands at 13:15 and the US open at 14:30. That gap decides whether your Thursday belongs to the Euro Stoxx future or to the E-mini, and your account currency decides the rest.
 Order flowOrder Flow for Greek Traders: The Evening E-mini SessionThe American cash open lands at half past four in Athens, after work and before bedtime. That is the only window where the order book is dense enough for tape reading to mean anything.